Staff — March 6, 2015
Plant production in nurseries is exposed to different risks including financial, economic, human resources, legal and production risks. These risks are not isolated but are interconnected. Nursery producers have navigated challenging conditions during the last recession as demand for their products dropped and remained low for several years. The sale of nursery products is now spurred by the improving housing economy, consumer spending, and robust consumer demand to grow edibles. No matter whether a nursery caters to new trends or stays with its traditional plant palette, assessing the risks of its operation is a prudent approach in the management of its business.
Nursery business owners have a number of tools to manage different risks. The first step is to identify which risks are most relevant to an operation. In a strong economy, access to a labor pool and to skilled labor can be a challenge. Expansion of production at a rapid pace brings with it possible problems in product quality, inadequate infrastructure, or expansion at a rate greater than the needed capacity. In a weak economy, marketing, declining plant quality, and access to credit can be a problem. Regardless of the economic conditions, natural disasters have impacted states in the Western U.S. on a regular basis. Flooding, hail, fire and drought can severely impact plants and infrastructure in a nursery.
Human resources
The nursery industry is labor intensive, and workers are a valuable asset. The cost of labor accounts for 40 percent or more of production costs in nurseries. A trained worker with special skills, knowledge of all the plants produced, and an understanding of the whole production system in an operation is valuable and can be difficult to replace.
Replacing a worker is expensive. There are costs for lost productivity until the position can be refilled, co-workers taking on part of the responsibilities of the vacant position, costs for advertising and recruitment, and costs for training a new employee. A study by the University of California found that it takes on average two months for nonprofessionals to achieve full productivity. The average replacement cost in 2003 dollars for manual labor workers was $2,000, and for professional and managerial workers it was $7,000.
The workforce in the nursery industry is diverse. A survey in nine states found that, on average, more than 70 percent of the workforce is Hispanic. Survey responses indicated that fewer than a quarter of the workers understood English, and almost two thirds were not trained in their work. Turnover of labor was about 50 percent after five years.
Training can improve worker retention. A previous survey found that Hispanic employee training in nurseries improved relationships between workers and managers, and led to greater company loyalty. Workers identified lack of benefits, low salary and job accidents as the leading work related issues. Effective training programs for the Hispanic workforce take the language, cultural background, age, and different learning styles into account.
The publication “Ag Help Wanted: Guidelines for Managing Agricultural Labor” is a comprehensive guide for human resource management. Tools and tips for dealing with staffing, supervising, managing employee performance, and improving communication and problem solving are covered. The publication can be accessed on the website wwww.AgHelpWanted.org.
Mechanization
One way to reduce the risks associated with training and managing a large labor force is to analyze which tasks can be mechanized or automated. Mechanization replaces humans with machines to complete a task. Automation makes use of several mechanized systems to replace human labor to increase efficiency on a larger scale.
Several studies in the Southeastern United States investigated how to enhance labor performance in the green industry (http://coastal.msstate.edu/nursery automation.html). Researchers examined the level of mechanization in nursery and greenhouse operations in the northern Gulf of Mexico states. Results showed that more mechanization was implemented in greenhouse-only operations compared to nurseries, in larger acreage versus smaller acreage nurseries, in operations with greater annual gross sales, and in nurseries using computers to schedule production.
Surveys in seven southern states interviewed 137 operators of nurseries and combined nursery and greenhouse businesses about the type of automation and mechanization they used for different tasks routinely performed by workers. Containers were filled manually in 47 percent of the operations, and plants were placed manually in containers in 69 percent of the businesses. Sixty-one percent of companies moved containers from the potting area to transport vehicles by hand. Less than 8 percent used conveyors or other means to mechanize this task.
Of the firms surveyed, 36 percent transported containers to the field manually, 75 percent placed containers in the field manually, and 80 percent spaced containers manually. Irrigation was most automated and was applied manually in 22 percent of the operations surveyed. These results show ample opportunity to implement available automation and mechanization technology to improve processes in the nursery.
Significant time savings and reduction of repetitive motions for workers can be attained by using mechanized dispensers, electric pruners, conveyors or other equipment to reduce handling of individual pots. Combinations of automated potting machines, continuous media mixing and watering tunnels can optimize potting operation. Computerized nursery- wide irrigation systems with feedback from existing moisture conditions or demand can apply irrigation more precisely. Robots to space, collect and respace various size pots have been developed and can move 200 to 300 containers per hour, 24 hours a day. Each business needs to evaluate which tasks can be most easily automated as well as the payback period for mechanization.
Nursery production costs
Production costs have a great effect on profitability of a nursery business. Recording all expenses in appropriate categories shows where money is spent in production. Cost analysis can compare expenses over time periods but also for individual products. This supports decision making on pricing and which products to keep or eliminate from production to maintain profitability. Other factors influence the composition of the product mix and include trends in plant materials, product demand and competition.
Production costs include direct and indirect costs. Direct costs include expenses for supplies and labor that can be directly accounted for a specific type of plant. Each plant carries an overhead cost for its time in production in the nursery. This is calculated as the annual unallocated costs in the nursery and expressed per square foot production space and per week. Expenses for irrigation, weed control and other maintenance are often difficult to determine for individual products and are added to the general overhead costs. Cost estimates improve in precision as more direct expenses can be allocated to a product.
A spreadsheet has been developed by faculty from the University of Arizona and the University of Hawaii to calculate the total cost of individual products based on the space and time they grow in the nursery (http://cals.arizona.edu/extension/riskmanagement/managing_finance_risk/index.html). Production costs for individual products or groups of similar products, such as plants in the same size container growing the same length of time at the same spacing, can be calculated. Costs for supplies, labor and the amount of space and time in the nursery will be calculated for different production stages as plants move from smaller to larger containers and from can-tight spacing to greater square footage per plant.
The spreadsheet can calculate whether a plant will make a profit or result in a net loss by using production costs and projected high or low sales prices. Different scenarios of having a longer or shorter production time, using different supplies, or decreasing the percentage of loss in production can be assessed. Calculations can determine which container size yields the highest profit for a species or cultivar, and for how long the plant will remain profitable at that size.
A projected profit comparison of growing plants in the nursery versus buying stock of different sizes from other nurseries is also included. The spreadsheet does not replace accounting software, but is intended to support decisions on pricing, product mix, and increasing efficiency in production.
Nursery insurance
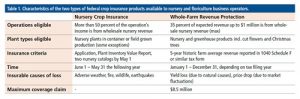
Nursery insurance is one of the tools to manage risks in production nurseries where perishable goods are exposed to weather, marketing and production risks. For nursery growers, there are two types of federal insurance products underwritten by the Risk Management Agency (RMA) (www.rma.usda.gov). Both cover growing products, but one uses a whole operation revenue based approach (Whole-Farm Revenue Protection or WFRP), and the other uses an inventory value approach (Nursery Crop Insurance). Table 1 lists some features of the two insurance products that can work together or independently. WFRP is available to growers in 15 counties in California including Butte, Fresno, Kern, Mendocino, Monterey, Riverside, San Diego, San Joaquin, San Luis Obispo, Santa Barbara, Sonoma, Tulare, Ventura, Yuba and Yolo; in all of Alaska except North Slope and Northwest Arctic, and in all other states in the U.S. except Arkansas, Louisiana, Mississippi, Oklahoma and Texas. Crop insurance agents can be found on the RMA website to assist with specific estimates for an operation (www3.rma.usda.gov/apps/agents/).
Evaluating whether nursery crop insurance should be considered for your business starts with reviewing whether the insured causes of loss are a threat in your area. Are adverse conditions such as freeze, wind, hurricane, fire, wildlife or failure of irrigation supply due to drought a risk for your operation? The insurance does not give operators carte blanche to neglect best practices for growing and adequately protecting plants from such hazards, but requires that good practices are followed. If your nursery is potentially affected by any of the insurable losses, the next step is to evaluate whether only container plants, field-grown plants, or both should be insured.
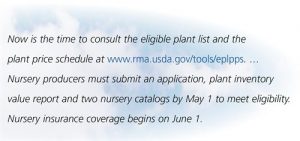
Now is the time to consult the eligible plant list and the plant price schedule at www.rma.usda.gov/tools/eplpps. Creating a crop inventory valuation report is the most time consuming task required to calculate the plant inventory value. Each plant species and cultivar needs to be listed by botanical and common name, container size and number of plants in the inventory at the time when insurance is purchased. Nursery producers must submit an application, plant inventory value report and two nursery catalogs by May 1 to meet eligibility. Nursery insurance coverage begins on June 1.
Coverage levels between 50 to 75 percent of the plant inventory value can be purchased with premium subsidies. The most basic coverage is the catastrophic coverage level, which is available for a flat administrative fee of $300, the premium fully subsidized, and covers 27.5 percent of the plant inventory value. At coverage level of 50 percent of the plant inventory value, the premium is subsidized by two thirds and one third is paid by the nursery. Under the highest coverage level of 75 percent, the premium subsidy is 55 percent and the nursery pays 45 percent of the premium.
WFRP provides insurance coverage for multiple agricultural commodities in one product. It is available for a wide variety of agricultural crops grown in the U.S. For example, an operation that produces nursery plants in containers, cut flowers, and citrus fruit in an orchard can use WFRP to cover all three commodities. The plan provides protection against low revenue due to unavoidable natural disasters and market fluctuations that affect income during the insurance year.
WFRP insurance eligibility requires that farms have five consecutive years of farm tax history records and that no more than 35 percent of expected revenue up to $1 million is from nursery/greenhouse or animals and animal products. A one-year insurance coverage period applies to the tax year, either by calendar or fiscal year. Purchase periods for the insurance are county-specific, and closing sales dates are February 28 or March 15. Contact a crop insurance agent for details and eligibility for each of the insurance programs. Coverage levels between 50 to 85 percent of revenue are available, and payment rates and subsidies vary by the number of commodities covered. A premium calculator is available at https://ewebapp.rma.usda.gov/apps/costestimator/.
While there is some overlap between the two insurance products, WFRP covers a broader spectrum of products and lost revenue from market fluctuations compared to nursery crop insurance. Both products cover a portion of loss due to adverse weather and other natural disasters. Businesses that produce a number of different crops and have some income from animals or animal products may find the WFRP product more flexible because they cover a range of commodities.
Ursula Schuch is Extension Specialist and Professor in the School of Plant Sciences at the University of Arizona, Tucson; she can be reached at [email protected]. Trent Teegerstrom is Specialist in Production Economics, Crop Budget Development and Risk Management Education in the Agricultural Economics Department at the University of Arizona, Tucson; he can be reached at [email protected].
Literature Cited
Behe, B.K., A.W. Hodges, J.P. Newman, T. Teegerstrom, P. Kenkel, and U.K. Schuch. 2014. Business Management Basics, Chapter 18. In Newman, J. (ed) Container Nursery Production and Business Management, p. 269-291. Univ. of Calif. Agric. and Nat. Resour. Publication. Richmond, CA.
Coker, R.Y., B.C. Posadas, S.A. Langlois P.R. Knight, and C.H. Coker. 2010. Current mechanization systems among nursery-only and mixed operations in selected Gulf South states. Mississippi Agricultural and Forestry Experiment Station Bulletin 1189, Mississippi State, Mississippi.
Dube, A., E. Freeman, and M. Reich. 2010. Employee replacement costs. Working Paper Series, Institute for Research on Labor and Employment, University of California Berkeley, p. 1-54. http://escholarship.org/uc/item/7kc29981 (accessed 8/27/2012).
Martinez-Espinosa, A.D., M. Fonseca, and W. Chance. 2003. Reaching the Hispanic ‘Green industry’ workforce: Experiences and practical tools for Extension Professionals. Journal of Extension 41(6) www.joe.org/joe/2003december/tt3.php (accessed 2/12/2015)
Mathers, H.M 2003. Technical information requested by Hispanic nursery employees survey results from Oregon and Ohio. J. Environ. Hort. 21:184–189.
Mathers, H.M., A.A. Acuña, D.R. Long, B.K. Behe, A.W. Hodges, J.J. Haydu, U.K. Schuch, S.S. Barton, J.H. Dennis, B.K. Maynard, C.R. Hall, R. McNeil, and T. Archer. 2010. Nursery worker turnover and language proficiency. HortScience 45:71-77.
Posadas, B.C., P.R. Knight, R.Y. Coker, C.H. Coker, S.A. Langlois, and G. Fain. 2008. Socioeconomic Impact of Automation on Horticulture Production Firms in the Northern Gulf of Mexico Region. HortTechnology 18(4): 697-704
Rosenberg, H.R., R. Carkner, J. Hewlett, L. Owen, T. Teegerstrom, J.E. Tranel, R.R. Weigel. 2002. Ag Help Wanted: Guidelines for Managing Agricultural Labor. Western Farm Management Extension Committee. Website: wwww.AgHelpWanted.org
Cover Photo: iStock | Chemlamp